Global Mobile Data Traffic Forecast by Region
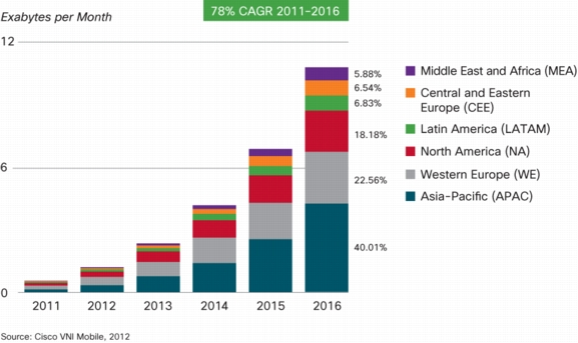
Cisco Forecasts 10.8 Exabytes per Month of Mobile Data Traffic by 2016
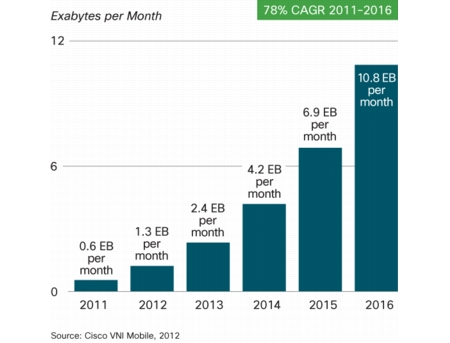
Laptops and Smartphones Lead Traffic Growth
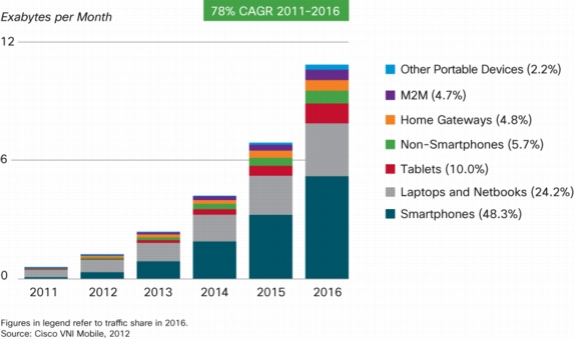
Global Mobile Data Traffic, 2011-2016
|
2011 |
2012 |
2013 |
2014 |
2015 |
2016 |
CAGR |
|
|
By Application Category (TB per Month) |
|
|
|
|
|
|
|
|
Data |
174,942 |
329,841 |
549,559 |
864,122 |
1,349,825 |
2,165,174 |
65% |
|
File sharing |
76,764 |
114,503 |
154,601 |
204,617 |
261,235 |
361,559 |
36% |
|
Video |
307,869 |
736,792 |
1,545,713 |
2,917,659 |
4,882,198 |
7,615,443 |
90% |
|
VoIP |
7,724 |
10,327 |
12,491 |
15,485 |
22,976 |
35,792 |
36% |
|
Gaming |
6,957 |
13,831 |
24,388 |
40,644 |
77,568 |
118,330 |
76% |
|
M2M |
23,009 |
47,144 |
92,150 |
172,719 |
302,279 |
508,022 |
86% |
|
By Device Type (TB per Month) |
|
|
|
|
|
|
|
|
Nonsmartphones |
22,686 |
55,813 |
108,750 |
196,262 |
357,797 |
615,679 |
94% |
|
Smartphones |
104,759 |
364,550 |
933,373 |
1,915,173 |
3,257,030 |
5,221,497 |
119% |
|
Laptops and netbooks |
373,831 |
612,217 |
917,486 |
1,340,062 |
1,963,950 |
2,617,770 |
48% |
|
Tablets |
17,393 |
63,181 |
141,153 |
300,519 |
554,326 |
1,083,895 |
129% |
|
Home gateways |
55,064 |
108,073 |
180,562 |
267,545 |
376,494 |
514,777 |
56% |
|
M2M |
23,009 |
47,144 |
92,150 |
172,719 |
302,279 |
508,022 |
86% |
|
Other portable devices |
525 |
1,460 |
5,429 |
22,966 |
84,204 |
242,681 |
241% |
|
By Region (TB per Month) |
|
|
|
|
|
|
|
|
North America |
118,972 |
259,283 |
493,323 |
844,416 |
1,304,870 |
1,964,477 |
75% |
|
Western Europe |
180,370 |
365,722 |
683,843 |
1,160,571 |
1,704,596 |
2,437,922 |
68% |
|
Asia Pacific |
205,624 |
437,601 |
831,616 |
1,502,748 |
2,614,055 |
4,322,879 |
84% |
|
Latin America |
40,171 |
77,242 |
145,794 |
267,327 |
455,463 |
737,808 |
79% |
|
Central and Eastern Europe |
34,317 |
67,722 |
133,716 |
252,930 |
439,143 |
706,469 |
83% |
|
Middle East and Africa |
17,810 |
44,868 |
90,610 |
187,254 |
377,953 |
634,765 |
104% |
|
Total (TB per Month) |
|
|
|
|
|
|
|
|
Total Mobile Data Traffic |
597,266 |
1,252,438 |
2,378,903 |
4,215,246 |
6,896,080 |
10,804,321 |
78% |
Source: Cisco, 2012
